
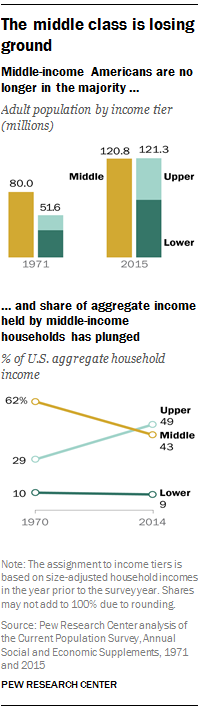
Over the last half Century, data has shown the middle-income households are slowly disappearing from the American economic landscape. “Middle-income” is defined by Pew Research center, as being two-thirds to double the median household income after adjusting for house size—around $42,000 to $125,000 for a family of three. Data from late last year shows that the middle-income class now includes only 120.8 million adults compared to the 121.3 million in the combined lower-income class and upper-income class. Middle income households currently account for 43% of all household income, a significant drop since 1970 when they accounted for 62% of incomes. In contrast, upper-income households (those making more than double the median income) have gone from 29% of household incomes to 49% in the same time period.

Recent research has looked has looked at the effects this trend has had on metropolitan areas across the United States. The Pew Research center found that from 2000 to 2014, the number of adults living in the middle-income bracket fell in 203 of the 229 metropolitan areas studied. Of these 229 areas 53 showed drops of more than 6%, while nationally there was 4% drop in middle-income shares.
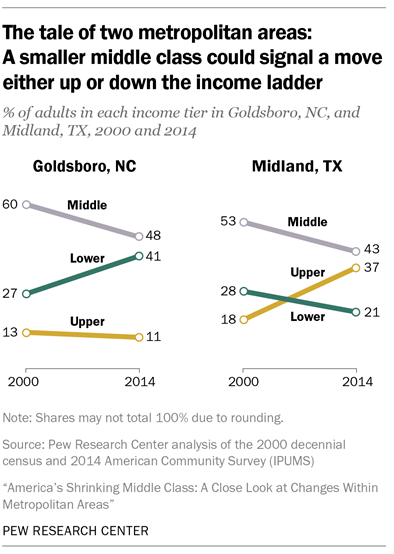
Explanations given for the changes income groups vary, but one possible explanation for the increase in the lower-income households may be due to a decrease in manufacturing jobs. This may be the case in places like Goldsboro, North Carolina (which experienced a 12 point loss in middle-income households, the largest of all the cities). For a more detailed look at the different effects the middle-income decrease has had on different metropolitan areas refer to this New York Times article highlighting the changes in 100 of these areas.
Futher Reading:


No comments :
Post a Comment